
25 October 2026 · 9 min read
Marketing dashboard checklist: from numbers to your next move
 Özlem Değirmenci GülserCEO & Co-founder, GrowthWise
A marketing dashboard is one screen that shows how your marketing is doing across channels. A good one answers three questions every week: can I trust these numbers, what do they mean when every channel is read together, and which move will have the biggest impact this week?
Why most marketing dashboards don't lead to a decision
Most founders we work with have started executing: the site is live, ads are running, content goes out. What they cannot see is which next move would make the biggest difference, and why. The dashboard shows what happened in each tool. It does not rank what to do next.
A typical marketing analytics tool puts each source in its own tile: sessions from Google Analytics, clicks from Search Console, spend from Google Ads. Each tile is correct on its own. The decision sits between them. Is paid search buying demand your own pages could win? Is the channel that looks smallest the one that converts best? Is a good month real, or is your own team's traffic inflating it? No single tile answers these.
The second problem is trust. A dashboard shows every number with the same confidence, whether the tracking behind it is sound or broke last Tuesday.
The nuances technical founders tend to miss
Founders who built the product are usually experts in their field, not in growth. The numbers are in front of them, but a few readings take experience:
- A red number is not always bad. A falling average search position means you moved up. Fewer visitors with more sign-ups usually means low-intent traffic thinned out.
- The smallest channel can be the most valuable. Visits from AI assistants are often a tiny share of traffic and convert far better than search, because the comparison already happened in the chat.
- Paid and organic compete for the same searches. If you buy a term in Google Ads that your own page could rank for, part of that spend is avoidable.
- Dirty measurement creates fake wins. Internal admin pages, payment-page returns and test environments counted as visits can make engagement look better than it is.
The marketing dashboard checklist
Run these eight checks on the dashboard you have today, whether it is a spreadsheet, Looker Studio or a BI tool. You can make your own copy of the checklist in Google Sheets and score your own dashboard.
- It shows how far each number can be trusted. Before any chart: are conversions counted once, are campaign links tagged, is internal traffic filtered, are any days missing? If you have never checked, start with our GA4 audit checklist of ten checks before you trust your numbers.
- It has one goal metric at the top. Demo requests, trials, purchases: the one outcome the business is chasing this quarter. Everything below should explain movement in that number.
- Every channel is read as one system. Paid search, organic search, AI assistants, social, email and direct on the same view, with the same goal metric. A channel judged alone is judged wrong.
- Money and results are compared in the same cut and period. Spend by term, campaign or country next to conversions by the same cut and dates. This is the only honest way to read marketing ROI and to measure ROAS.
- Disagreements are shown, not averaged. When Google Ads and Google Analytics report different conversion counts, the dashboard shows both and says which one it uses. Our guide on what to do when your marketing numbers disagree walks through the usual causes.
- Each move has an expected contribution. Not forty metrics, but three to five moves ranked by how much each is likely to move the goal metric, how sure you are, and what it costs.
- Each move becomes a brief for one person. Who does it, the steps, the numbers it rests on, and the metric that will show whether it worked. A junior marketer cannot act on "improve SEO".
- It checks last week's moves. Did the task finished two weeks ago move the metric it was meant to move? Without this line, the dashboard measures activity, not whether anything worked.
Passing three or four of these is normal. Checks 1, 6 and 7 are the ones we see missing most often.
A real example: one month, read as one system
This is from our consulting work, with the company's name and identifying details removed and the figures rounded. A developer API company serving e-commerce businesses saw a bad month on its dashboard: sessions, users and new users all down 8-10%. Read tile by tile, the conclusion was "traffic is falling, spend more". Read together, the same month said something else:
- Measurement first. Internal admin pages were counted as visits, payment-page returns opened new sessions, and the same paid channel was tagged two ways. Part of the "longer sessions" win was the team's own use.
- Paid and organic overlapped. One search term, the main competitor's name plus "api", was bought in Google Ads with a four-figure monthly budget and was converting. In organic search the same term had about 2,200 impressions a month at position 8.5, and 6 clicks. The company was paying for demand its own page could win, and that page already converted well.
- The smallest channel converted best. Visits from AI assistants were under 2% of sessions but turned into sign-ups at roughly twice the rate of organic search. In the dashboard they sat inside "referral".
- The volume drop was not a demand problem. Every channel fell by about the same share and none collapsed, while organic sign-ups rose. Low-intent traffic was thinning out.
The moves, ranked by expected contribution: clean the measurement first, because every later decision depends on it; then one SEO sprint on the competitor-name page, since the ad data had already proven the term's value; then AI assistant visibility as a channel with its own line in the report. Each move went to one owner as a brief with steps, the numbers behind it and the metric to judge it by. No single dashboard tile showed any of this.
Weekly marketing report or dashboard: which do you need?
A dashboard is something you open. A weekly marketing report is something that arrives. For a founder with no time, the report usually matters more.
The best weekly report we know is short: what we can trust this week, the goal metric, what changed and why, the ranked moves with an owner each, and what last week's moves did. If a growth manager makes these calls alone today, the same structure gives them a record of every decision and how it turned out.
A note from Özlem Değirmenci Gülser, founder of GrowthWise: "I am not sure how much analytics data on its own moves a founder's growth. The numbers are there. What I keep seeing is that someone with experience has to put them together and guide the execution step by step. Execution is king, but you rarely get execution data from a dashboard."
We built this rhythm running growth for 42 technology companies since 2020. The tools changed from company to company. The weekly structure did not.
How GrowthWise helps
GrowthWise is a growth brain for founders. It reads your analytics, search, ad and CRM data together, checks every number, and turns it into a weekly plan your team can execute.
- Several specialists, one plan. An ad auditor, a measurement auditor, a site auditor, a competitor watcher and a content planner each read their part. Their findings are weighed together into one ranked list of moves.
- Distilled growth judgment. Every move reads all connected sources together, says what the numbers mean, and names the conflicts between them, the way a senior growth leader would.
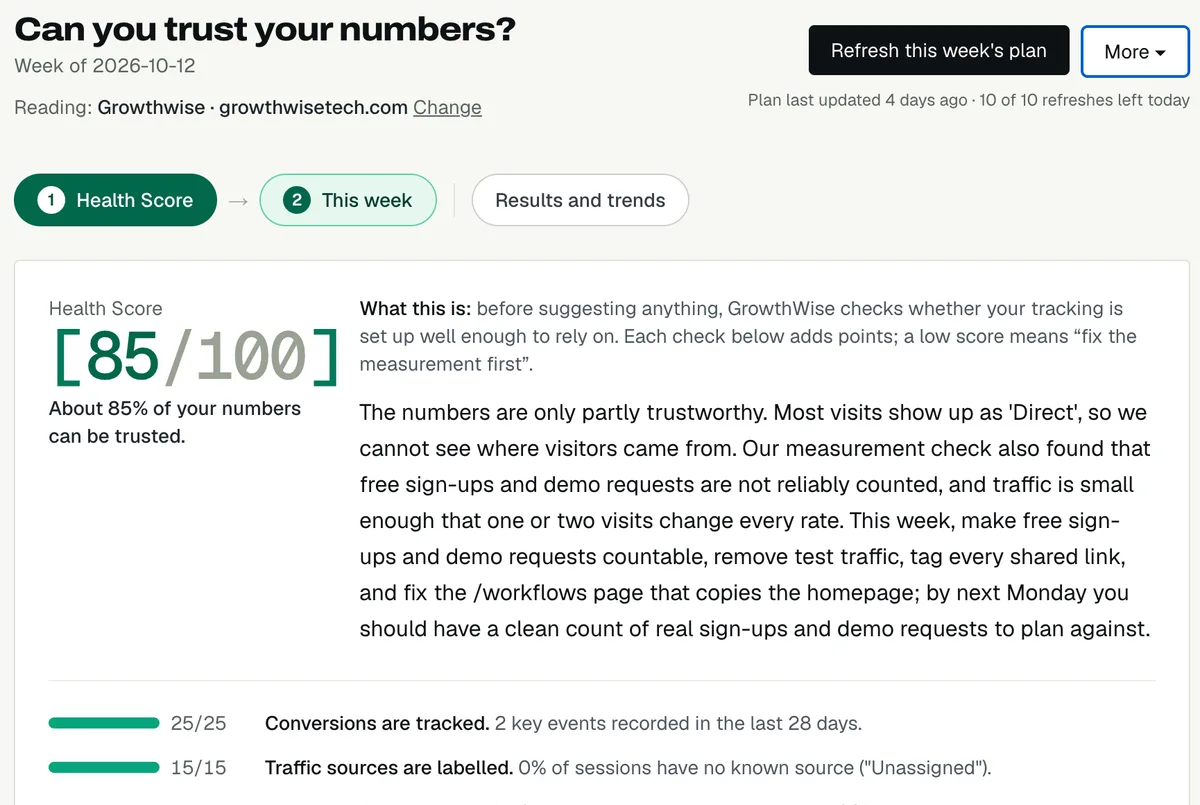
- Numbers you can trust. A Health Score shows how far your data can be trusted, and every figure in a move is checked against the source data before the plan is saved.
- Learning from what you tried before. Your team's notes on past decisions and experiments, and the "did it work?" result of every finished task, go into the next plan.
- A brief for every person. Each move becomes a task with an owner, step-by-step instructions, the data it rests on and the metrics to watch. The plan arrives in Slack, and you can ask about it in your own Claude through the GrowthWise MCP for Claude.
Start with the free GA4 audit: a Health Score and three moves for this week in about two minutes, read-only and with no credit card.
FAQ
Why doesn't my marketing dashboard tell me what to do next?
Because it shows each channel separately and every number with the same confidence. Knowing the next move takes reading all channels together, checking which numbers can be trusted, and ranking moves by their expected contribution to one goal.
Is Google Analytics 4 enough as a marketing dashboard?
It can hold more than most people think: you can link Google Ads and Search Console, and import cost data from other ad platforms. What it will not do is judge which numbers to trust, resolve conflicts between sources, or rank what your team should do this week.
How do I know which marketing channel to invest in next?
Compare every channel against the same goal metric over the same period, including small ones like AI assistants, and check where you pay for demand you could win organically. Then put money and effort where the expected contribution per unit of cost is highest.
How do I give a junior marketing team clear weekly priorities?
Give each person one or two moves with the steps, the numbers behind them and the metric that will show whether it worked. A list of metrics is not a brief.
What should a weekly marketing report for a startup founder include?
How far this week's numbers can be trusted, the goal metric, what changed and why, three to five ranked moves with an owner each, and what last week's moves achieved.
Sources
Özlem Değirmenci Gülser
CEO & Co-founder, GrowthWise
Sixteen years on the commercial side of technology companies. Since 2020 GrowthWise has run growth for 42 of them; the product turns that method into a weekly plan.
LinkedIn